April 1, 2015 – The stock market reacted badly today after ADP announced a disappointing 189,000 jobs created in March. CNBC was all aflutter with talk of a potential miss on Friday’s big jobs report. However, March set an all-time high for withholding-tax collections in a single month at $218 billion (click chart to enlarge):
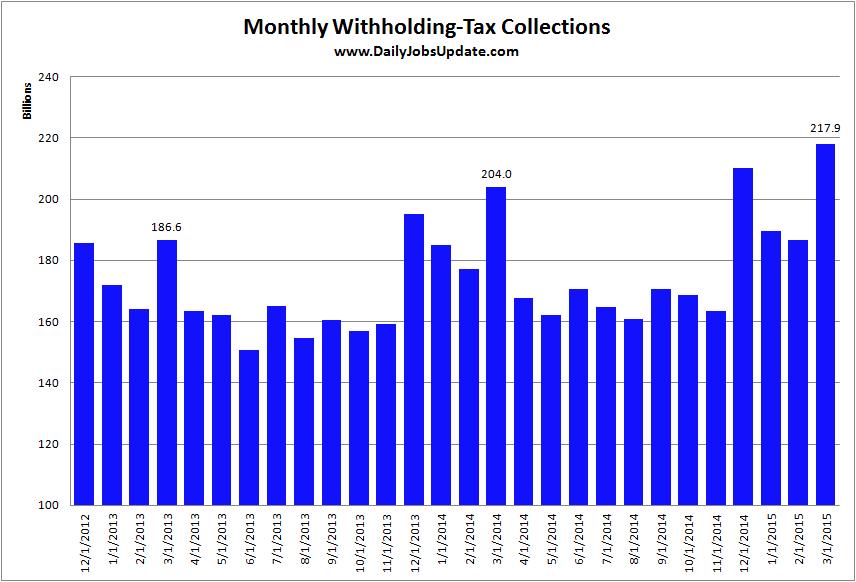
March 2015 was up a strong 6.81% over March of 2014 while the first quarter came in at 4.96%. Looking at this lumpy data in calendar periods isn’t the best approach, so the next chart shows the a 21-day moving average of the Q/Q growth rate:
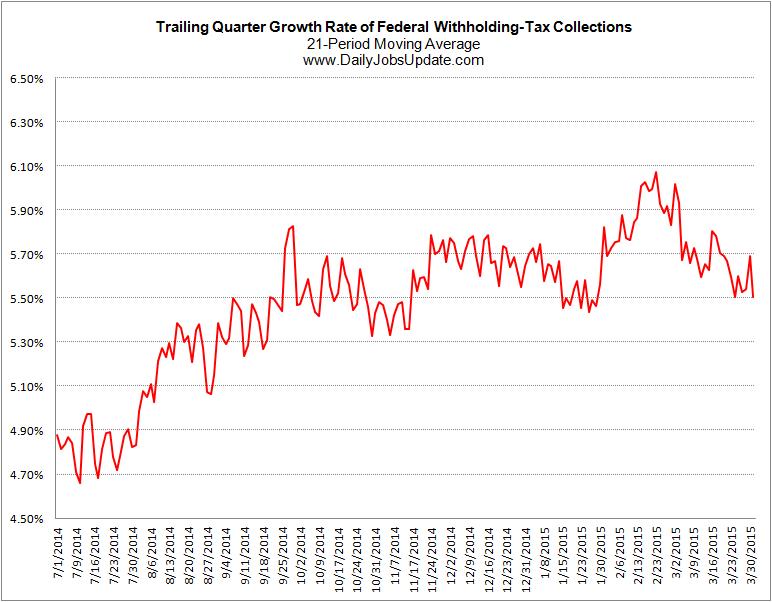
After a surge in late February and early March, the growth-rate has dropped back into its recent range of 5.50-5.75%. Perhaps it has topped-out, but that remains to be seen, and 5.5% is a very healthy growth rate. In any case, there is no chance that anything catastrophic happened in the jobs market during the month of March.
Of course, the stock market has not been cheering the strong jobs data in recent months. It has reacted negatively to the last four reports – all of which delivered upside surprises. The chart of the DJIA below shows (at the red arrows) the date, and number of jobs added for the last four reports:
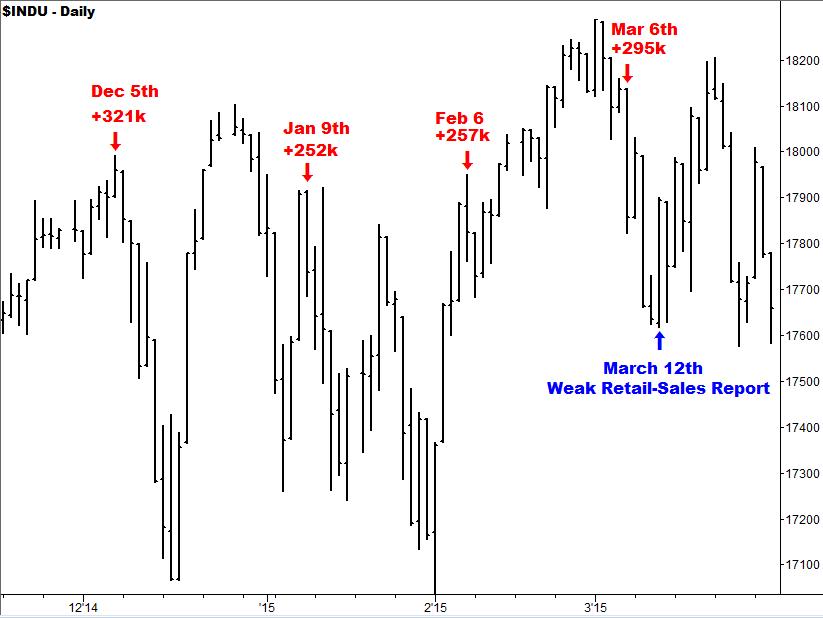
As you can see, the market made substantial pullbacks after all but the February 6th report where it only dropped for two days. Also, notice how the market dropped after the March 6th report until March 12th when a terrible retail-sales report was released. Economists were expecting an increase of 0.6%, and the number printed at -0.1% – a huge miss. But the market rampaged higher all day, and for several more days. So, the moral of the story is that bad news is good news as the market trembles before possible Fed interest-rate hikes.
This dynamic won’t continue forever, of course. If the Fed were to make a tiny increase, say a quarter point, and the world didn’t explode, then investors would likely stop worrying so much. But until we see that, we have to assume that the market will continue to correct on good news and rally on bad news.
Also, the market rallied up to the last four jobs reports, which is not the case this time, barring a huge rally on Thursday. So this report is occurring in the middle of the 2015 trading range, and may consequently have a smaller impact.
In an extreme bearish resolution, the current Descending Triangle pattern on the Dow (red lines) would extend down about 650 points to the 17,050 level where a large number of dip-buyers stepped-up on February 2nd:
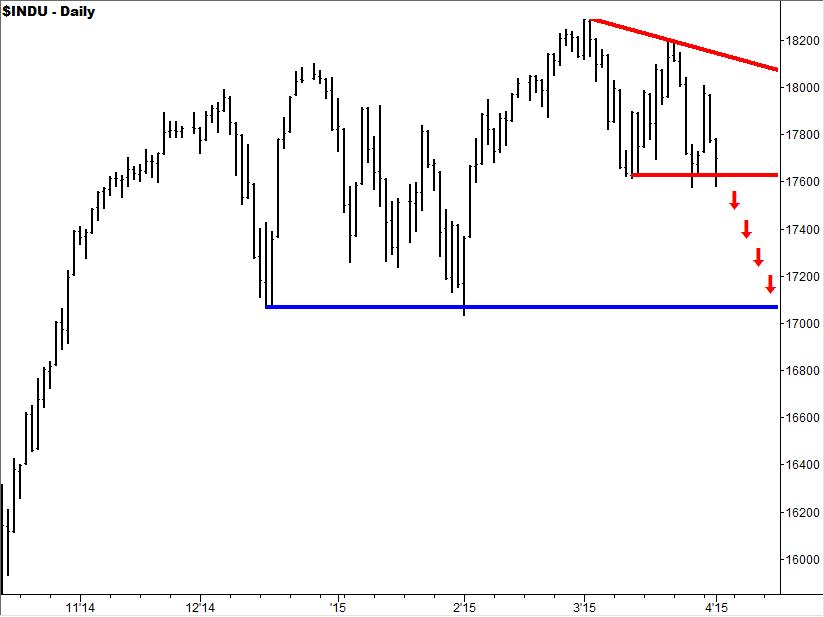
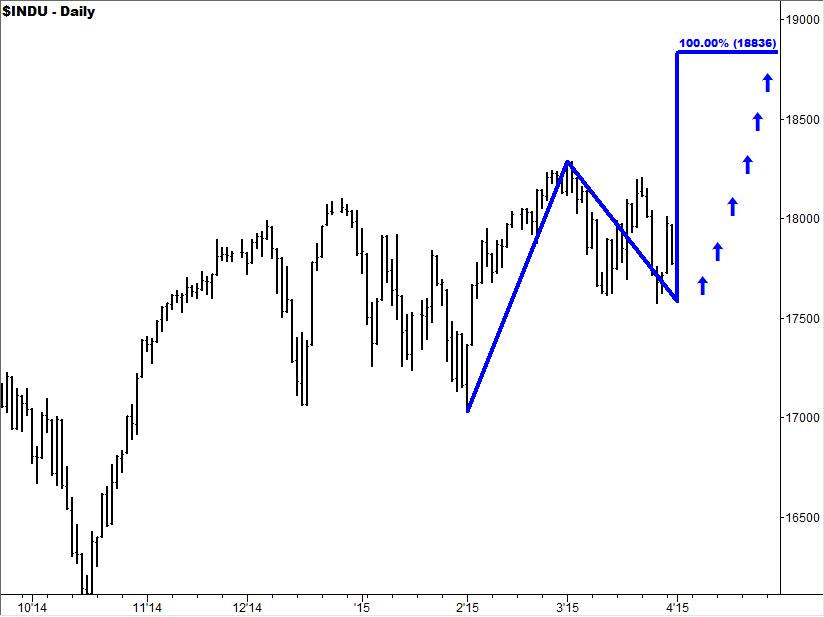
In an extreme bullish resolution, the triangle will function as the consolidation phase of the February rally, with an upside target of 18,836:
The stock market will be closed for Good Friday when the jobs report is released, however futures will be trading until 9:15am ET. So, we will have 45 minutes of reaction in the futures, and then of course, the usual open at 6pm ET on Sunday night.
If you are unfamiliar with futures and want to follow along, here are the major symbols:
ES – S&P 500
YM – Dow Jones Industrials
NQ – NASDAQ-100
TF – Russell 2000 (RJ is used on some systems)
The “front month” is the June contract, designated as “M” and the year is 2015, so the full symbol might be ESM15 for the S&P 500. I say “might” because there is a lot of variation from system to system. Delayed quotes are available for free around the web, including at the CME and Barchart.com.
-Matt