Our special, adjusted data series reflects the 2019 government shutdown, the 2018 Trump Tax Cut, the 2013 tax increases, the 2011 Social Security tax cut, the 2010 Census hiring, and the 2009 “Making Work Pay” tax credit. All of our charts marked “adjusted” are made from this data series, rather than the raw data.
2019 – Government Shutdown
The government shutdown ran from December 22, 2018 to January 25, 2019 and took a large bite out of withholding tax collections. How big of a bite? We will never know the answer precisely because nobody knows how many workers went without pay. Yes, we know how many employees the federal government has, but nobody keeps track of how many contract workers there are. One professor estimates that the contract workforce is double the size of the permanent workforce: about 4 million workers. That army of people ranges from security guards to IT workers to scientists working for NASA.
The Congressional Budget Office published some estimates as to the impact on GDP, but nothing on wages.
So, due to the lack of data we must resort to an estimation. The method we will use is as follows: we will determine the growth-rate of withholding-tax collections during the shutdown. Then we will take the growth rate of the period directly following the shutdown, calculate the difference, and then add back that difference to the shutdown period. So, if growth were -1.50% during the shutdown, and 5.00% afterward, then we would adjust the shutdown period upward by 6.50% to bring it up to 5.00%, presuming that jobs growth was roughly the same during both periods.
We don’t want to start our shutdown benchmark period on December 22, 2018 because that is right in the middle of the volatile holiday retail-staffing season. Instead, we will wait for the data to calm down a bit and begin on Monday, January 7, 2019. We will then take the next three work-weeks ending on Friday, January 25, 2019. Tax collections during that period were $127.48 billion. During the corresponding period from 2018, collections were $132.61 billion. So, there was a contraction of 3.87% (at the very least) caused by the shutdown.
When the shutdown ended, the GSA said that federal employees would have their back-pay by January 31, 2019. (Contractors did not receive back-pay.) While that may have been the case, it looks like many government agencies did not make their withholding-tax deposits until the first week of February. So, those deposits were much larger than usual. Consequently, we won’t start our second benchmark period until Monday, February 11, 2019 and end it on Friday, March 29, 2019.
Yes, that is seven weeks, making it longer than the first benchmark period. However, the withholding data is very lumpy and you always want to use copious amounts of data. This period will give us the best flavor of the true growth rate in 1Q2019. So, during that period, $377.25 billion was collected versus $359.46 during the corresponding period from 2018, yielding a 4.95% growth rate.
Therefore, we adjust the collections during the shutdown period upward by 8.82% (3.87% + 4.95%) to update our adjusted data-series.
Note: there was a tax-cut implemented in 2018. However, tax rates were the same in 1Q19 as they were in 1Q18, so there is nothing to worry about there.
2018 – Trump Tax Cuts
The Tax Cuts and Jobs Act of 2017, commonly referred to as the “Trump Tax Cuts” went into effect on January 1, 2018. By the end of January 2018, it was clear that the cuts would put a large dent in withholding-tax collections, and an adjustment would be needed to track the growth of the labor-force going forward. A description of the method used follows.
First, we are talking about the year-over-year growth. Looking at this data month-to-month is futile because of the huge seasonal effects in employment.
Second, we assume that the growth of the economy in January remained within the same ballpark as it was in in December; that nothing drastic happened. So, if we see an x% drop in the growth-rate after the tax-cuts take effect, we want to adjust tax collections upward by x% to restore the original growth-rate.
However, since most workers are paid with a two-week (or so) delay, withholding-tax collections did not take a hit immediately on January 1st, but rather mid-month. So, after giving a little time for the dust to settle, we look at the data on January 26, 2018, and see a growth-rate of 5.3%. That’s comparing the first 18 data-points of 2018 to the first 18 data-points of 2017. That’s a small sample, but if we use a larger sample of the quarter ending on January 26th compared to the quarter ending on January 27, 2017, we still see about a 5.3% growth-rate.
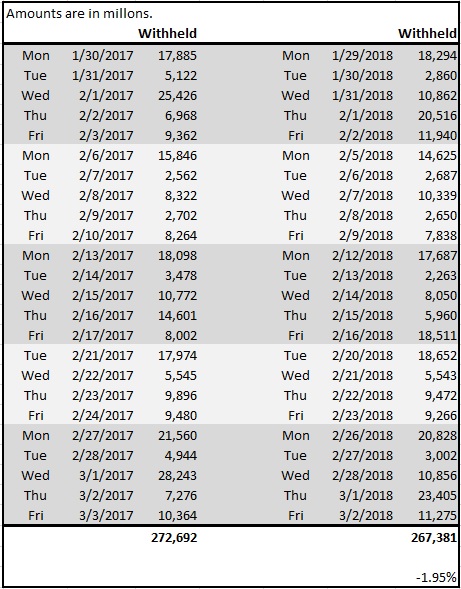
Now that we have a target growth-rate of 5.3%, we need to select a benchmark period to see how much the tax-cuts knocked that rate down. Because we are talking about paychecks here, we want to compare work-weeks. So, the following chart shows the next five work-weeks; comparing 2017 to 2018. This is a good period because the calendar is in-sync, and there is only one holiday (President’s Day) that occurs in the middle, not causing any disturbance. As you can see, $272.7 billion was collected during this period in 2017, but only $267.4 in 2018 – a reduction of 1.95%.
So, now we just have to figure out what it would take to make that shortfall go away. How much would we have to add back into the 2018 collections to make them show +5.3% instead of -1.95%? And that number is 7.4%. Another way to think about it is that the tax-cut took a 7.4% bite out of FICA withholding.
The last thing that we need to do is decide when to start applying this adjustment. There is no precise way to do this since the Treasury Department does not designate the year of the collections. We presume that the collections in the first couple of weeks of January are from money earned in December, but we can’t say much more than that. So, we have arbitrarily chosen January 17, 2018 to be the first day where collections are adjusted upward.
How long into the future do we make this adjustment? At first glance, it seems like the adjustment should continue until Congress acts again to change the tax-rates. However, we are always looking at the data year-over-year, and consequently, the purpose of our adjustments is to facilitate that analysis. Therefore, if the tax-rates are not changed in 2019, then we will stop adjusting the data. The reason why is that when we compare the raw data, we will get an apple-to-apples comparison. So, if next year, we were to compare the un-adjusted data from February 2018 to the raw data from February 2019, we will get a clean growth rate because both months were ruled by the same tax-rates.
In other words, it is not important for our purposes to know what tax-collections would have been had there never been a tax-cut because we are interested in the growth-rate rather than the absolute level of collections.
2017 – No Changes
This is the fifth consecutive year with no significant changes to withholding-tax rates.
2013 Social Security Tax Cut Expiration
On January 2, 2013 the American Taxpayer Relief Act of 2012 became law, and the 2011 Social-Security tax cut expired. The bill included a small income-tax increase in the upper-income brackets, but the withholding tax revenue it generates looks to be insignificant in the grand scheme of things, so we have decided to not adjust the data for it. The bill also included changes to taxes on capital gains, dividends, estates, and itemized deductions. However, none of those will effect withholding. To learn more about the bill, see this New York Times story.
The adjusted data series will be the same as the raw data going forward until there is another major change in the tax code. For 2013, the year-over-year comparisons of the raw data will look overly strong because tax rates have gone up. So, the adjusted-data charts will show, lower-, and more-accurate growth rates until the end of 2013. If there are no tax-rate changes in 2014, the adjusted charts will show the same growth rates as the raw-data charts until Congress acts again.
2011 Social Security Tax Cut
Starting on January 1, 2011, individuals are taxed 4.2% for Social Security instead of the previous 6.2%. There is no cut for the employer, so they still pay 6.2%. In total, the Social Security tax has been cut to 10.4% as compared to 2010’s 12.4%. (Read more here.)
However, withholding taxes are collected all in one lump. Income tax, Social Security, and Medicare are not paid by employers separately. And they are not reported separately by the Treasury Department in the Daily Treasury Statement. So, we will determine the impact of the new tax-cut by using a benchmarking approach.
How much did the tax-cut reduce revenues in January 2011? The Congressional Budget Office reported that revenues increased by 9%. However, that is the wrong way to look at the data. The CBO just looked at the monthly totals, but because of the way paydays fall, and the lack of perfect calendar synchronization, it is critical to look at work-weeks rather than calendar periods.
If you look at the first four work-weeks of 2011, you see only a 0.26% increase over the same period in 2010. And that is the best way to handle this data. It was about flat.
Now we compare that to the growth-rate that prevailed before the tax-cut kicked in. For 4Q10, the growth rate was 8.04%. However, Christmas 2010 and New Year’s Day fell on Saturdays, so there were no days-off for those two holidays, and that created a distortion. The last four work-weeks of 2010 had a 12.36% growth rate, which is almost certainly unrealistic.
So instead of using the 4Q10 growth rate for our benchmark, we leave off the last two weeks. We also leave off the first week (#40) because it also had a calendar distortion. The ten-week period between weeks #41-#50 had a pretty steady 6.53% growth rate, and it is reasonable to assume that growth continued at around that pace into 2011.
January 2011 was about flat, and 2010 was running at a 6.53% rate, so it is reasonable to assume that the tax-cut reduced withholdings by about 6.5%. And our adjusted data-series now reflects that assumption.
It is also important to keep in mind that the government will not announce any exact numbers about how much less tax gets collected as compared to last year. It just doesn’t ever provide such detail. So, making estimates is the only option. The Congressional Budget Office will be the only part of the government to comment on the subject, and we believe that they used the wrong methodology.
Additionally, nobody knows how many companies implemented the changes in January. The IRS gave employers until January 31st to get it done, however there were no penalties for being late because the Congress and the President took so long to complete the bill.
So, -6.5% is the best guesstimate that we know of. You might be wondering: how could a 2% cut only to the individual part of the Social Security tax result in a 6.5% drop? The answer to that is that we are not looking at month-to-month numbers, but year-over-year. The December-to-January reduction was much less than -6.5%, but we are trying to estimate the annual growth rate.
It’s confusing at first, but if you think about it, it makes sense. In fact, there is so much seasonality in employment in the USA that month-to-month comparisons are an exercise in futility. That’s why the BLS always makes such huge revisions to their data: they try to estimate month-to-month changes before employers actually tell them the number of employees they had via subsequent tax filings.
So, what we have done here is assess the impact of the tax-cut on the year-over-year growth rate. And that is a completely different number from the month-to-month change.
March 5, 2012 Update: The -6.5% turned out to be an excellent estimate. As of today, the year-over-year growth rate stands at +6.78%. That’s using the first 44 business days of 2012 as compared to the first 44 business days of 2011. Tax rates were identical for these two periods.
Note: The “Making Work Pay” tax-credit (discussed below) has been discontinued as of December 31, 2010.
2010 Census Bureau Hiring
The Census Bureau’s temporary army of census-takers peaked in May 2010 at 585,729. And while that is a large number of workers, it is not very significant to an economy the size of the USA’s. So, we estimate that the CB’s effect on withholding-tax collections was $1.2 billion in total. And that is a tiny amount relative to the time period in which it took place.
The CB published tables showing weekly head-count, but they do not appear to have disclosed the total payroll, or any details on how many hours were worked each week, or how much the average worker was paid. So, we used information from census workers around the country, and media reports, to estimate that the average worker put in the equivalent of 40 hours per week at $18.18 per hour.
Using the CB’s weekly head-counts, we estimate that their total payroll was $4.715 billion.
Since the CB published the head-counts weekly, we adjusted withholding-tax receipts downward on the Friday of each week between January and October 2010.
A spreadsheet with the calculations is available to subscribers upon request.
2009 “Making Work Pay” Tax Credit
This tax credit went into effect in April 2009. The IRS published new tax tables, and withholding-tax receipts were substantially reduced until the credit expired at the end of 2010.
Nobody knows by how much receipts were reduced by the tax credit. This data is not widely used as an economic indicator, so there is no government office with a team of economists performing analysis. Of course, the fact that the data is not widely studied is what gives it its edge.
The only commentary on the subject comes from the Congressional Budget Office in their “Monthly Budget Review” reports. And even there, there is no hard data, but only guesstimates. (See the excerpts from each report below.) In 2009, the CBO ranged from saying that 33%-50% of the year-over-year decline in withholdings could be attributed to the tax credit. Toward the end of 2009, they stopped even making the guesstimates. It really is anybody’s guess, so why don’t we settle on a figure of 40%?
(Note: The numbers used in the following examples are in thousands to simplify the calculations. For example, total receipts in July 2009 were $131.4 billion.)
Let’s use July 2009 as an example. Receipts were $131,416,000. In July 2008, receipts were $142,963,000. So, there was a $11,547,000 shortfall. If 40% of that were attributable to the tax credit, that number would be $4,618,000.80. And if we were to add that back to $131,416,000, we get $136,034,000.80.
Now, the withholding taxes are reported each business day, and that is how they are stored in the database. So, we want the daily numbers for July 2009 to add up to $136,034,000.80. We will therefore add a small amount to each daily number such that they add up correctly. That number is the percentage difference between the actual withholdings and our adjusted withholdings. So the calculation is:
If we add 3.514% to each number in April 2009, we should have an adjusted data series that is in the ballpark with the CBO’s guesstimates. But the payroll data is lumpy since the majority of paychecks go out on certain days of each month, and the calendar shifts from year-to-year, so let’s use a longer period: April-November 2009.
Withholding for April-November 2009 were: $1,028,483,000
Withholding for April-November 2008 were: $1,133,563,000
The shortfall was $105,080,000.
40% of the shortfall is $42,032,000.
The adjusted amount for April-November 2009 is $1,070,515,000.
And our daily-adjustment factor is:
So, MWP was accounted for by increasing each daily amount reported by the Treasury between April 1, 2009 and December 31, 2010, by 4.09%.
Congressional Budget Office commentary on withholding taxes since April 2009:
Report for April 2009 published on May 7, 2009:
“Compared with receipts in April 2008, withholding for income and payroll taxes fell about $14 billion (or 10 percent). CBO estimates that more than one-third of that decline is attributable to provisions of the recently enacted American Recovery and Reinvestment Act of 2009 (ARRA), most notably the Making Work Pay credit. Those provisions will continue to contribute to year-over-year declines in withholding for the next 11 months.”
Report for May 2009 published on June 4, 2009:
“Withheld income and payroll taxes fell by $16 billion (or 11 percent), primarily because of recent legislation and the effects of the recession. CBO estimates that more than one-third of the decline in withholding resulted from provisions in the American Recovery and Reinvestment Act of 2009 (ARRA), notably the Making Work Pay credit.”
Report for June 2009 published on July 8, 2009:
“Withholding for income and payroll taxes was about $13 billion (or 9 percent) less than that in June 2008. CBO estimates that more than half of the decline in withholding resulted from provisions in the American Recovery and Reinvestment Act of 2009 (ARRA), notably the Making Work Pay tax credit.”
Report for July 2009 published on August 6, 2009:
“Withholding for income and payroll taxes was about $11 billion (or 8 percent) less than that in July 2008, CBO estimates; about half of that decline resulted from provisions in ARRA, primarily the Making Work Pay tax credit.”
Report for August 2009 published on September 8, 2009:
“Withholding of income and payroll taxes fell by $99 billion (or 6 percent) compared with receipts in the same period of 2008, primarily because of the ongoing effects of the recession on wages and salaries and lower effective tax rates on that income. CBO estimates that about one-third of that decline is attributable to provisions in ARRA, primarily the Making Work Pay tax credit.”
Report for September 2009 published on October 7, 2009:
“Withholding of individual income and payroll taxes decreased by about $18 billion (or 13 percent), due in part to provisions in ARRA, primarily the Making Work Pay tax credit, and continued weakness in salaries and ages.”
Report for October 2009 published on November 6, 2009:
“Withheld taxes also fell, but not as much. Throughout the fiscal year, withholding of individual income and payroll taxes was lower than in the previous year, causing a total decrease in withholding of $117 billion (7 percent). The decline resulted from the weakened economy, small year-end bonuses, and tax reductions enacted in the American Recovery and Reinvestment Act of 2009 (ARRA).”
Report for November 2009 published on December 4, 2009:
“The weakness in withholding stems from a combination of the effects of recent legislation and the slow growth of wages.”
Report for December 2009 published on January 7, 2010:
“Withholding…receipts were about $13 billion (or 8 percent) lower than those in the prior year. More than half of that decline is attributable to provisions of the American Recovery and Reinvestment Act of 2009 (ARRA) and the effects of the calendar (there was an additional Monday in December 2009, as compared with December 2008).”
Report for January 2010 published on February 4, 2010:
“Withheld individual income and payroll taxes declined by $11 billion (or 7 percent). About one-third of that decline is attributable to provisions of the American Recovery and Reinvestment Act of 2009 (ARRA).”
Report for February 2010 published on March 4, 2010:
“…withheld income and payroll taxes declined by about $3 billion (or 2 percent); excluding the effects of recently enacted legislation, withheld taxes were virtually unchanged from February 2009.”
Report for March 2010 published on April 7, 2010:
“Provisions of the American Recovery and Reinvestment Act (ARRA) reduced receipts in March 2010 relative to receipts last year, partially offsetting the increase from the extra business day this year.”
Report for April 2010 published on May 7, 2010
“Receipts in March and April suggest that tax revenues may soon begin to rise again. In the past two months, withheld income and payroll taxes have been greater than in the same months last year, presumably reflecting a rebound in wages and salaries and a much smaller impact from the Making Work Pay credit.”
In the quote above, CBO mentions a “much smaller impact”, however they don’t say why.
Report for May 2010 published on June 4, 2010
The CBO did not mention the Making Work Pay tax-credit in this report. They focus on year-over-year changes, and the tax-credit was in effect last May, so perhaps that is why they didn’t mention it.
The CBO did not mention the Making Work Pay tax-credit in the last seven reports of 2010 though it was in effect until the end of the year.
Withholding and Unemployment Benefits
You may have seen somebody arguing that withholding taxes are going up or down because of unemployment benefits. While unemployment benefits are taxable, withholding is not automatic. Recipients have to file a Form W-4V “Voluntary Withholding Request”. The IRS has not published any statistics (that we are aware of) on how many W-4V’s are filed, but it is probably a safe bet that most people do not file the form. They will still have to pay the taxes in April on their annual tax return, but those taxes would not be reported in the withholding data.
Also, when somebody loses a job, withholding taxes cannot go up because of unemployment benefits. If a worker is making $1,000 a week, loses his job, and then is collecting $293 a week (the national average) in unemployment, it stands to reason that withholding taxes can only go down.
Fluctuations in payments due to political wrangling about how long benefits should be paid likely have a negligible effect on withholding tax collections. Most people probably don’t have it deducted at all, and the tax on $293 is only about $20 (as of this writing). So, suppose that there are a million more people added to the unemployment program due to a new bill passed by Congress. Even if all of them have taxes withheld, it would only amount to about $20 million per week in withholding-tax collections, which is a small percentage of the billions that the Treasury normally collects each week.
The US workforce is very large – even during the worst of recessions. Aside from tax-rate changes implemented by Congress, and inflation, there are simply no other factors large enough to put a dent in the withholding tax data.
Miscellaneous Notes
All of the withholding-tax charts use nominal dollars. We may add an inflation-adjusted data series in the future, though inflation has not been a large factor since this data series began.
The government publishes this data promptly at 4pm Eastern time each business day – the same time that the stock market closes in New York City. At that time, we plug-in the new number, and all the charts update.
This data does not include taxes collected from self-employed workers. However, the ranks of the self-employed are still very small compared to clock-punchers, so that data can be ignored for our purposes here.
During 2001, and then again in 2003, there were payroll tax cuts to help boost the economy. We have not adjusted the data to account for those cuts. However, it looks like the majority of the plunge in withholdings in 2000 and 2001 happened before the tax cuts went into affect:
Economic Growth and Tax Relief Reconciliation Act of 2001.
Jobs and Growth Tax Relief Reconciliation Act of 2003
Tax-Tables Notes
2011 Tax Tables – The “Bush Tax Cuts” were extended, however income-tax amounts actually went up due to the end of the “Making Work Pay” tax-credit. The MWP credit was $400 per person, so most taxpayers will have $400 more withheld in 2011. The 2% Social Security tax cut for 2011 is done in a separate calculation and is not reflected in the tax tables.
2010 Tax Tables – The “Making Work Pay” tax cut was still in force for 2010, but withholdings had to be higher (per check) than 2009 because the cut did not begin until April 2009. The cut was spread over 12 months in 2010 instead of 9 months in 2009, so that reduced the tax break that workers received in each paycheck. The IRS also lowered the threshold for withholding, and increased the number of brackets. However, the Congressional Budget Office made no mention of either in their report on February 4, 2010, so perhaps the amounts were not significant. The IRS makes such small changes frequently and doesn’t explain why.
2009 Tax Tables – Amounts were reduced in order to implement the “Making Work Pay” tax cut. MWP took effect on April 1, 2009, so new tables were issued in the middle of the year. Workers had about $400 less withheld, spread over the remaining paychecks of 2009.